1D Linear Cutting
1D Linear Cutting optimizes any material that comes in lengths: steel bars, aluminium extrusions, copper pipe, timber battens, plastic tube, cable, threaded rod, and any other linear stock. You supply the available bar lengths and the required cut lengths — CutOptim finds the combination that uses the fewest bars with the least offcut waste.
How 1D Optimization Works
The 1D problem is simpler than 2D: every item has only one dimension (length), and every bin (stock bar) also has only one dimension. The algorithm assigns lengths to bars so that:
- Every required length is assigned to exactly one bar
- No bar is over-filled (all lengths assigned to a bar fit within the bar’s length, accounting for kerf)
- The total number of bars used is minimized
This is a variant of the bin-packing problem for one dimension. Rather than a single greedy pass, CutOptim runs several bin-packing strategies over the same job — first-fit, best-fit and next-fit decreasing, a spread-then-consolidate pass, and a subset-sum step that fills each bar as tightly as possible with a bounded knapsack (plus a repeating cutting-pattern step for high-quantity runs) — and keeps the best result, so it finds near-optimal solutions quickly even for hundreds of demand lengths.
For linear materials where length is the only relevant dimension — pipe, rod, bar, cable — use 1D mode. For materials like flat bar or angle where you might need to track width as well, consider using 2D mode with height set to the material width.
Adding Stock Bars
Stock bars represent your available raw lengths. Enter each bar size as a separate row.
| Feature | Type | Description |
|---|---|---|
| Length | number | Full length of the stock bar in the active unit (mm or cm). |
| Quantity | integer | Number of bars of this length available. The optimizer will use up to this many. |
| Price | number | Cost per bar. Used in the cost summary and quotation export. |
| Label | text | Optional description, e.g. '6m EN10210 CHS 60.3×4mm'. Appears in the PDF and CSV exports. |
Example: structural steel job
| Label | Length (mm) | Qty | Price |
|---|---|---|---|
| RHS 50×50×3 — 6000 | 6000 | 12 | 42.00 |
| RHS 50×50×3 — 3000 | 3000 | 4 | 22.50 |
In this example, CutOptim will draw from both the 6 m and 3 m lengths to fill the demand most efficiently.
Adding Parts
Parts are the cut lengths you need to produce. Each row in the Parts (1D) table represents one type of cut.
| Feature | Type | Description |
|---|---|---|
| Length | number | Required cut length in the active unit. |
| Quantity | integer | Number of pieces of this length required. |
| Label | text | Piece name or reference, e.g. 'Rafter A' or 'Handrail section'. Printed in the cut diagram and export. |
Example: aluminium handrail job
| Label | Length (mm) | Qty |
|---|---|---|
| Top rail | 2400 | 6 |
| Infill bar | 1000 | 24 |
| Post cap extension | 150 | 12 |
| Return end | 300 | 4 |
Running a 1D Optimization
- 1
Enter stock bars
In the Stock bars section, click + Bar and add each bar length with quantity and optional price. If you are buying material for the job (rather than drawing from existing stock), set a high quantity — the optimizer will only use as many as needed.
- 2
Enter demand lengths
In the Parts (1D) section, click + Part and add every required cut length with its quantity and label. If you have an existing cut list in a spreadsheet, use Import CSV from the CSV dropdown in that section header.
- 3
Set kerf width
Open Settings and confirm your kerf width. For a standard chop saw or angle grinder with a 3 mm disc, enter 3 mm. For a thin-kerf saw blade, enter 2 mm.
- 4
Run the optimization
Click Run optimizer at the bottom of the left sidebar, or press Ctrl+Enter. Results appear immediately.
- 5
Review bar diagrams
Each bar is shown as a horizontal rectangle in the canvas. Coloured segments represent demand pieces; grey segments are offcuts. Use the bar navigator to step through all bars.
- 6
Export your cut list
Open the Downloads menu in the top bar and choose CSV for a spreadsheet cut list, or PDF for a printable bar-by-bar diagram. On Pro the PDF also carries the sawing plan page.
Reading the Bar Layout Results
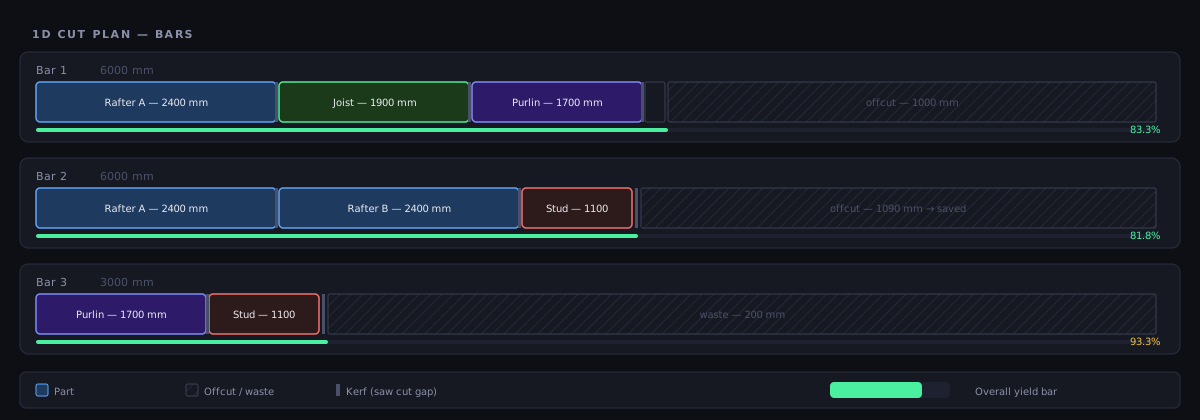
The canvas for 1D mode shows each bar as a horizontal strip divided into segments:
| Segment type | Visual | Description |
|---|---|---|
| Part | Coloured block with label | A required cut length placed on this bar |
| Kerf | Thin dark line | Material lost between each cut |
| Offcut | Hatched grey | Remaining length, larger than minimum offcut size |
| Waste | Solid grey | Remaining length, smaller than minimum offcut size |
Summary Metrics
| Stat | Meaning | Shown |
|---|---|---|
| Utilization | Total demand length / total used bar length × 100 | Always |
| Waste | Unusable scrap length | Always |
| Bars | Number of stock bars consumed | Always |
| Pieces | Placed / requested | Always |
| 💰 Material cost | Cost of the bars used | When stock prices are entered |
| Cuts | Number of blade passes in the plan | When there is at least one |
| Cut length | Total distance sawn — metres in mm mode, feet in inch mode | Only when Profile width is set (see below) |
| Cut cost | Cuts × your cost per cut | When cost per cut is set |
| Within tolerance | Pieces that fitted only because of kerf tolerance | When any were |
Reusable offcuts from the run are listed under the diagram, not as a header stat.
The Sawing Plan Pro
The bar diagram shows you what comes off each bar. The sawing plan tells you where to stop the blade, in order — which is the part nobody wants to work out in their head twenty times down a six-metre bar.
A bar has no cut tree: it is cut end to end from the head. So the plan is simply the running offset — after each part the blade drops at that mark, then advances by the kerf.
The steps on each bar, in the order you make them
- The calibration skim, if it is switched on. On a bar it always comes off the head — the start of the bar.
- The start-trim head cut, if a start trim is set.
- One step after each part — except a last part that finishes flush with the usable end of the bar when there is no end trim, because there the bar simply stops and no pass is needed.
Every step gives a stop position measured from the head of the bar: a number you can set on a stop, not a part length to add up. Head passes are named as such (Calibration, Start trim) and leave the order column blank, because they free no part.
Cut length — supply the profile width and you get one
Linear stock is a length and nothing else, so out of the box there is no cross-section for the blade to cross and CutOptim reports positions only. It will not invent a distance nobody measured.
You can supply the missing number. Profile width in Advanced settings — visible in 1D Linear only, and not gated by plan — is how wide the material is that the blade crosses on one cut. Set it and the sawn length appears:
- on the results header, next to the other run statistics — every plan;
- in the run summary — every plan;
- in the PDF, in the framed key figures under the sawing plan — Pro, with the sawing-plan page;
- in the Excel Cutting Sequence tab, in the Length column and in the totals — Pro, with the workbook.
Every counted cut crosses the profile once, so the figure is simply the cut count times the width you entered.
Left at 0 — the default — nothing changes. No length is shown anywhere, exactly as before. That is the honest default: we would rather report nothing than a number you did not measure.
The field never appears in Wood mode, which already knows the cross-section of every material, or in 2D, which measures the blade path from the cut tree. If one job mixes several sections, Wood mode is the right tool — a single profile width cannot describe it.
On screen
- The Cutting Sequence bar sits directly above the bar strips, at the top of the Bars box. Its controls are ◀ Previous, the step readout, ▶ Next, ⏮ Restart and ▶ Play (0.8 s per step, stopping at the last one).
- Below the cut list, the whole plan is listed as a Cutting Sequence table with the columns Order, Bar, Name and Position. Clicking a row jumps the player to that step, and the active row is highlighted — so the table and the player can never drift apart.
- On each bar strip the cut marks light up as you step: the current one solid, completed ones faded, upcoming ones hidden.
Why the step count matches the Cuts stat
On a bar every step is a single pass of the blade, so the number of steps and the Cuts figure in the results header are the same number, whatever your trim and calibration settings. Measured on the built-in demo job: 29 steps against 29 cuts with no trim, 39 and 39 with a 20 mm start trim, and 49 and 49 with the start trim and the calibration cut both on.
In the exports
- PDF — a Sawing plan page of its own, with the columns
#, Bar, Order, Name and Position, plus a framed strip of key figures under the table. - Excel (.xlsx) — a Cutting Sequence tab straight after the Cut list tab, with the totals repeated at the bottom so the tab stands alone at the saw.
Both need Pro, like the on-screen player. See Cutting Sequence for the full guide and Exports & Downloads for the page and tab layout.
Calibration Cut Pro
A calibration cut skims a thin strip off the head of every bar before any part is cut. You measure that strip, compare it with the number you asked for, and correct the stop by the difference — so the first real part is already accurate instead of being the one you sacrifice to find out the setup was off.
- The four-edge side picker you may have seen in 2D is hidden in 1D. A bar has one head, so offering a choice of four edges would be a control the plan could not honour.
- It rides on the start trim: the material reserved is start trim + calibration. That is what turns step 0 of the sawing plan into a real stop position rather than a line drawn on a picture.
- With both a start trim and a calibration cut set, the head is crossed twice — once for the strip you measure, once to take the rest of the trim off — and the sawing plan lists both passes.
See Settings for the control itself.
Stock Priority (★)
Each row in the Stock table has a star (★) icon on the left. Starring a stock row tells the optimizer to use those bars first — before any unstarred stock.
When to use it in 1D mode:
- You have a partial bar from a previous job and want to use it before cutting new stock
- You have bars in a less convenient location (different rack, another site) that you want to defer
- You want to clear old stock of a certain size before it corrodes or warps
Click the ★ icon to toggle it yellow/gold (prioritized) or grey (normal). The setting is saved per cut.
When adding inventory offcuts as stock, star them all. This tells the optimizer to exhaust your existing offcuts before opening new full-length bars — the most effective way to reduce material spend over time.
Importing Parts
For jobs with many cut lengths already in a spreadsheet or design program export, use the import tools in the Parts (1D) section header instead of typing each row manually. CutOptim supports paste from Excel/Google Sheets and CSV file import. See Importing Data for full instructions and column formats.
CSV Export for 1D Results
The CSV export for 1D mode contains one row per demand piece with the following columns:
| Column | Description |
|---|---|
bar_index | Which stock bar this piece was cut from (1-based) |
bar_label | Label of the stock bar |
piece_label | Label of the demand piece |
piece_length | Cut length |
position_from_end | Distance from the left end of the bar where this cut starts |
qty | Quantity (always 1 per row; multiple identical pieces appear as multiple rows) |
Sort the CSV by bar_index then position_from_end to get a sequential cut list for each bar — exactly the order you would make cuts at the chop saw.
Practical Example: Steel Frame Substructure
Job: Wall-mounted steel subframe for a commercial fit-out. 12 vertical uprights at 2700 mm, 18 horizontal rails at 1200 mm, 6 diagonal braces at 890 mm.
Stock available: 20 × 6000 mm lengths of 50×50×3 RHS at $41 each.
Settings: Kerf 3 mm, units mm, Guillotine mode (not applicable to 1D, but kerf matters).
Result: 9 bars used (instead of 12 if cut naively), yield 92.3%, estimated saving of 3 bars = $123 in material.
| Bar | Cuts |
|---|---|
| Bar 1 | 2700, 2700, 597 (offcut) |
| Bar 2 | 2700, 2700, 597 (offcut) |
| Bar 3 | 2700, 1200, 1200, 897 (offcut) |
| Bar 4 | 1200, 1200, 1200, 1200, 1200 (waste 194) |
| Bar 5 | 1200, 1200, 890, 890, 817 (offcut) |
| … | … |
The three 597 mm offcuts can be saved to inventory and used for future small pieces.